Firms are business entities that produce goods with raw material, capital, and labor. Capital is considered a fixed cost as this pertains to all the things that are bought and secured at the beginning of firm’s production. The cost of raw materials increase directly proportional to the amount of goods produced. However, by the nature of economics, as firms invest more and more labor into the production of a good, the marginal cost increases, causing it to be worth less.
To portray these effects and the average variable cost, average fixed cost, and average total cost of a production line, a cost curve graph is used.
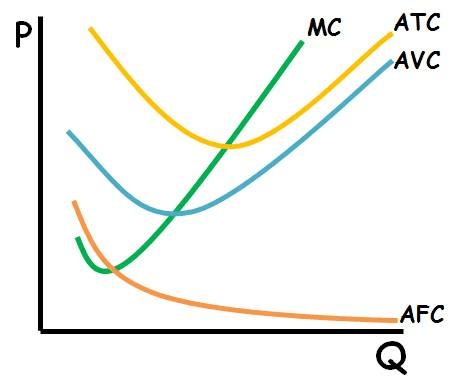
As seen, the MC starts to decrease and suddenly begins to increase. Although the marginal cost is increasing, the average variable cost and average total cost still decreases as long as the marginal cost is lower than those values. As a result, when the marginal cost passes the AVC and ATC, the AVC and ATC values start to go up as well. As a result, the point at which the MC curve intersects with the AVC and ATC curves is the minimum point for both cost curves. Finally, the average fixed cost graph is shown as constantly decreasing. This is logical since the graph depicts a fixed cost divided by an increasing number of products.
One final thing to note about the graph is that the ATC is a sum of the AVC and AFC graph. Therefore, as the number of products increase, the AVC and ATC graph will infinitely grow closer to each other. However, the permanently decreasing, yet existing, average fixed cost will prevent the two cost curves from ever intersecting.
Such is how modern economics graphically lays out the cost of a firm producing a certain good.
